Open Data Institute · 2025–26
OpenActive dashboard
A clearer way to explore the UK’s open data about places and activities.
Why it exists
OpenActive data covers thousands of sessions, classes and facilities across the UK. It was difficult to get a useful overview of all that data or see which publishers needed attention.
What I worked on
I built most of the public dashboard: its layout, filters, D3 map, API integration and tests. It reads from a separate .NET API over BigQuery; another teammate owns that API and the Python ingestion pipeline behind it.
A few details
- Next.js server functions fetch and cache data from the Monitor API. Custom client hooks keep recent filter results in memory.
- The D3 map switches between local-authority and NHS-trust boundaries. It can be filtered by area, publisher, provider, activity and NHS trust.
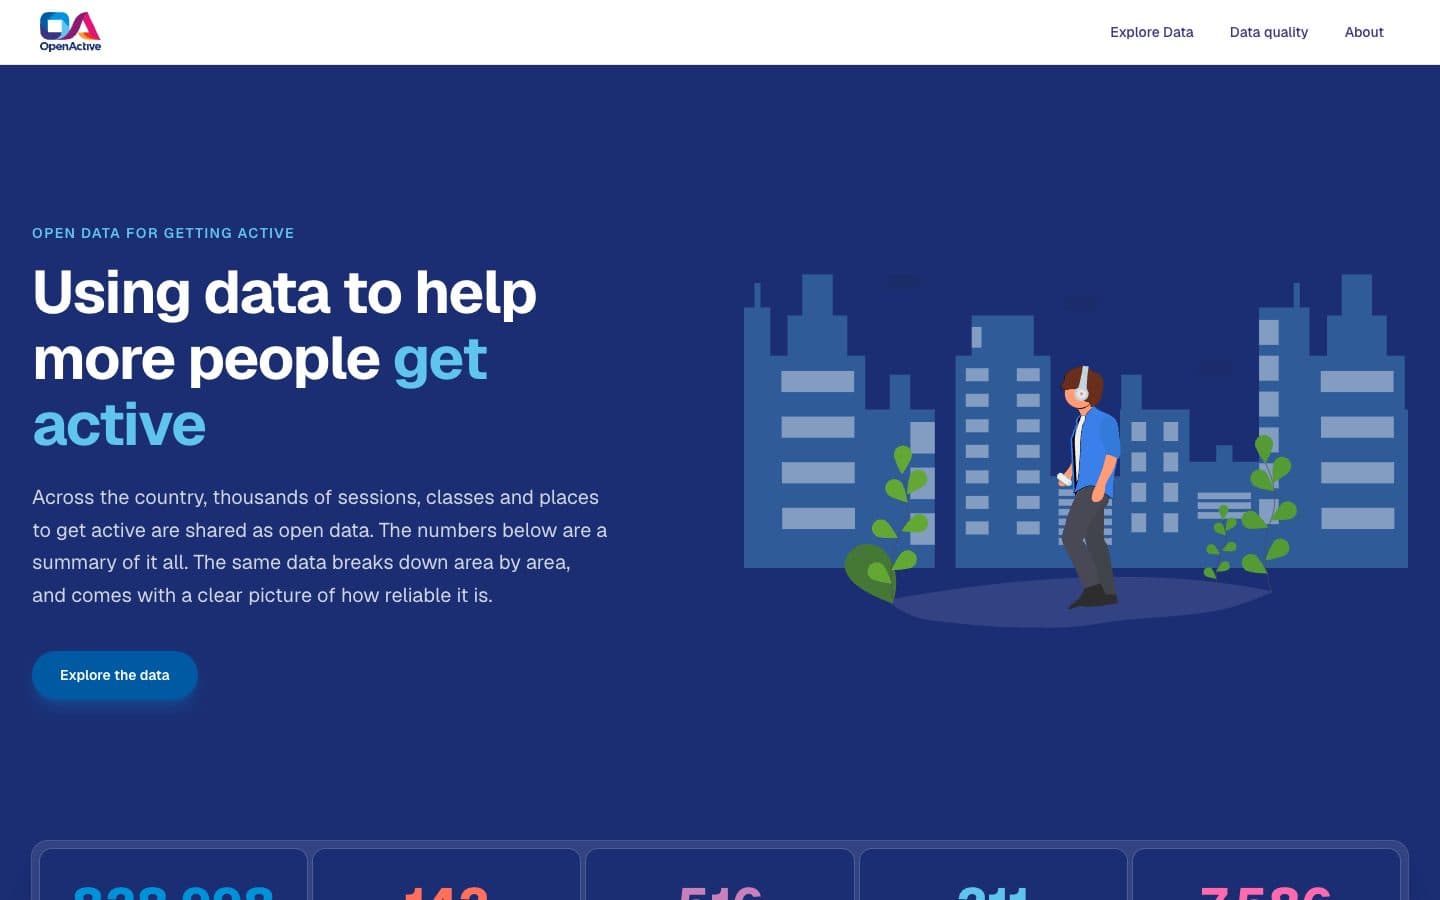
- The landing page gives a national summary. Inside the explorer, the summary follows the active filters and includes population, deprivation and Active Lives context where available.
- The feed-quality view uses the same filters and separates data completeness from content quality, with healthy, warning and error states.
- The repository has 243 Vitest and Testing Library tests. GitHub Actions runs the tests; ESLint and knip are local checks.